 Maxima Plugins
Description
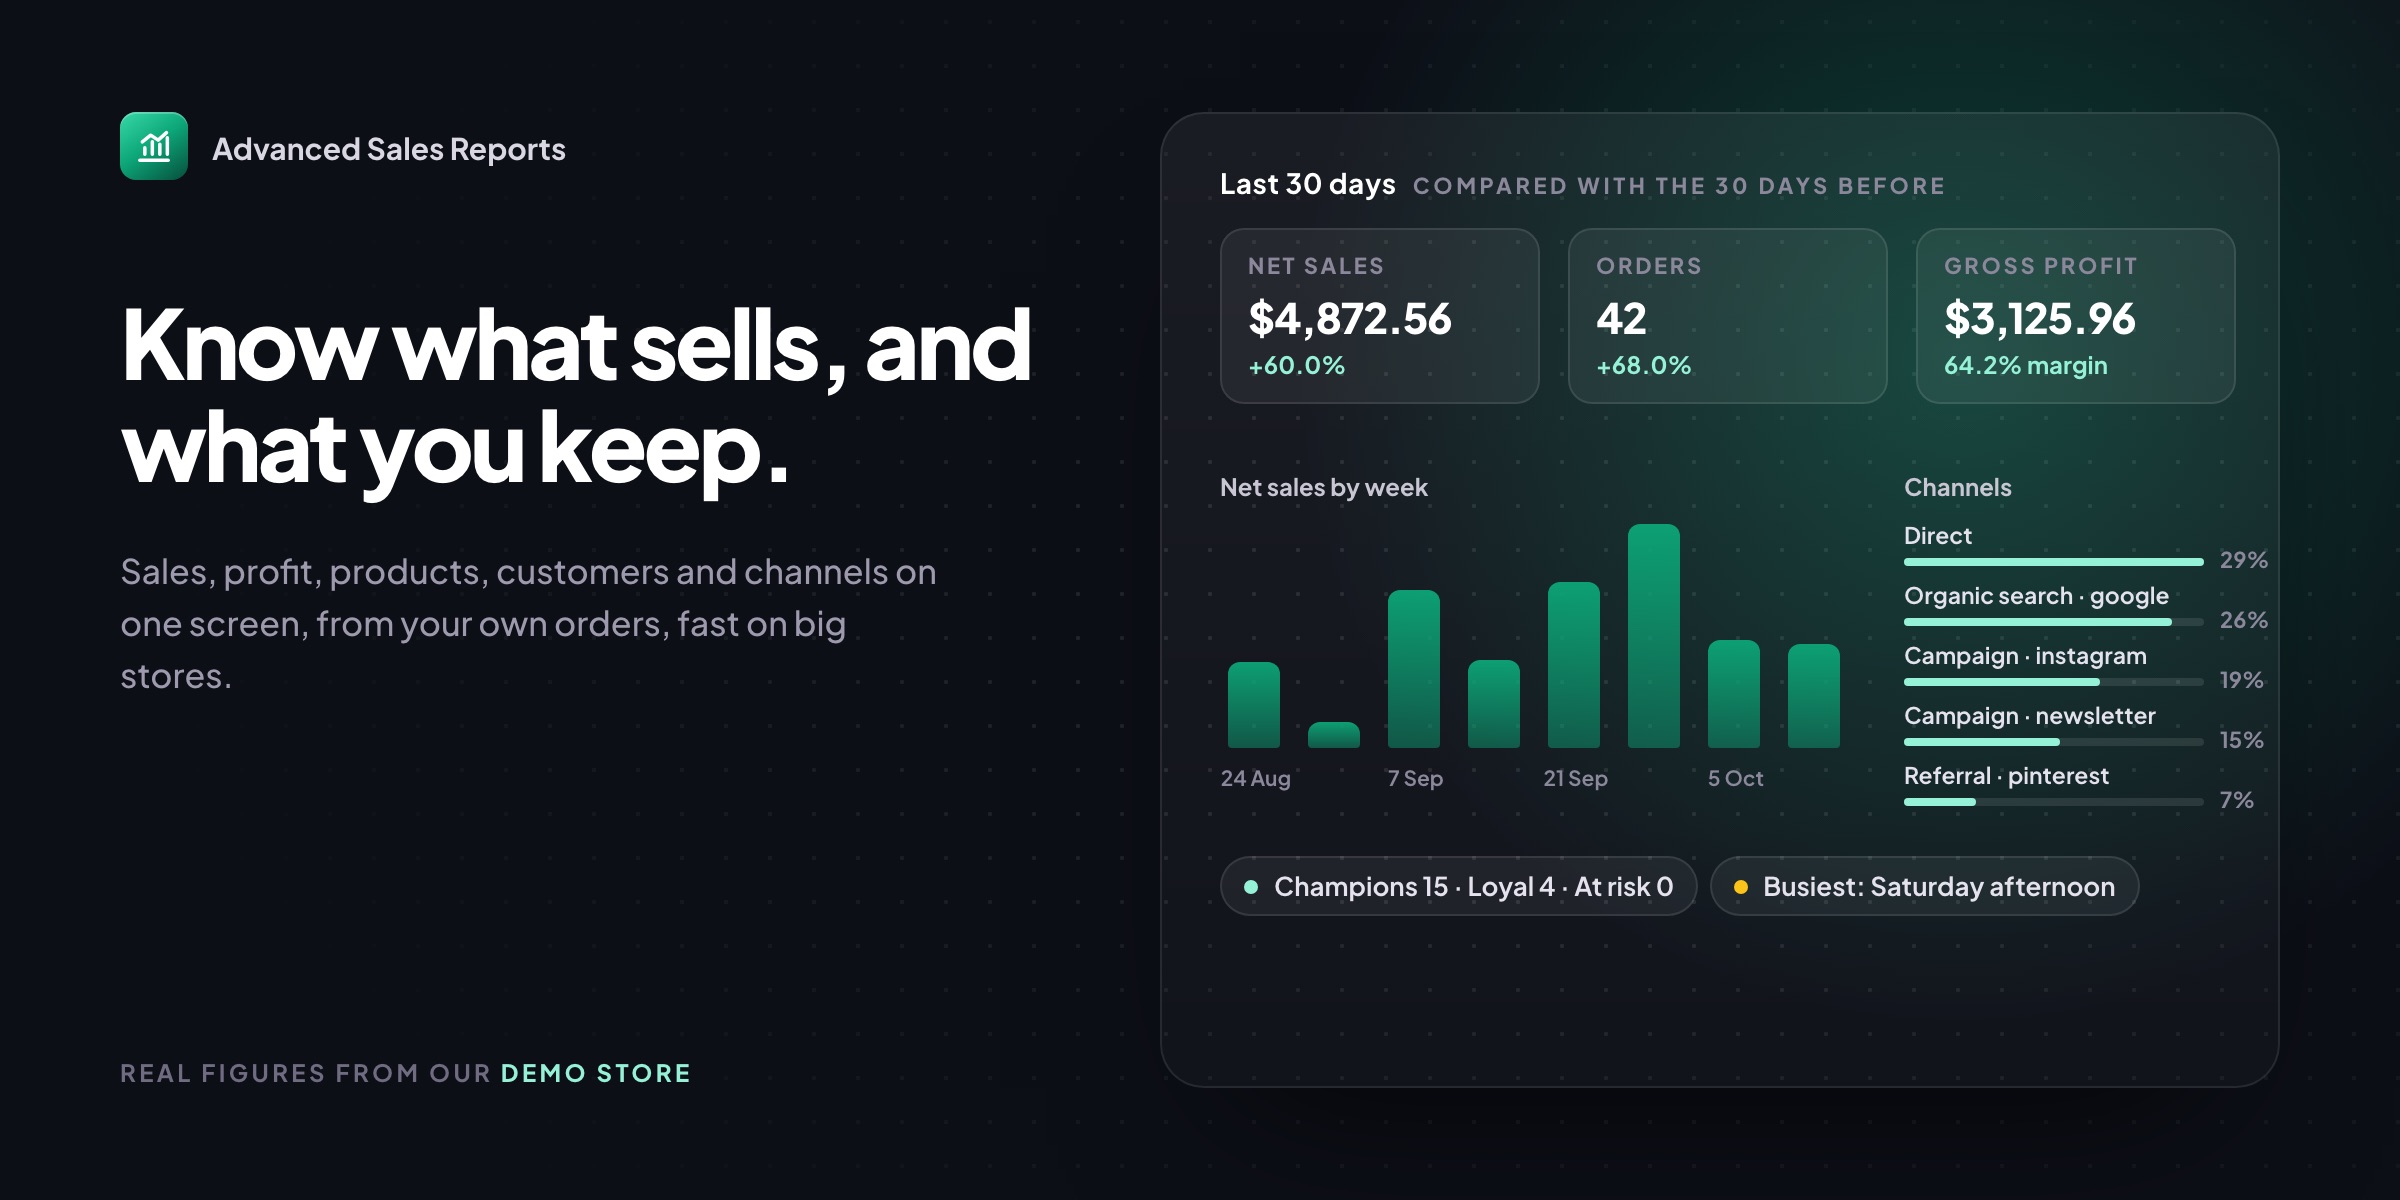
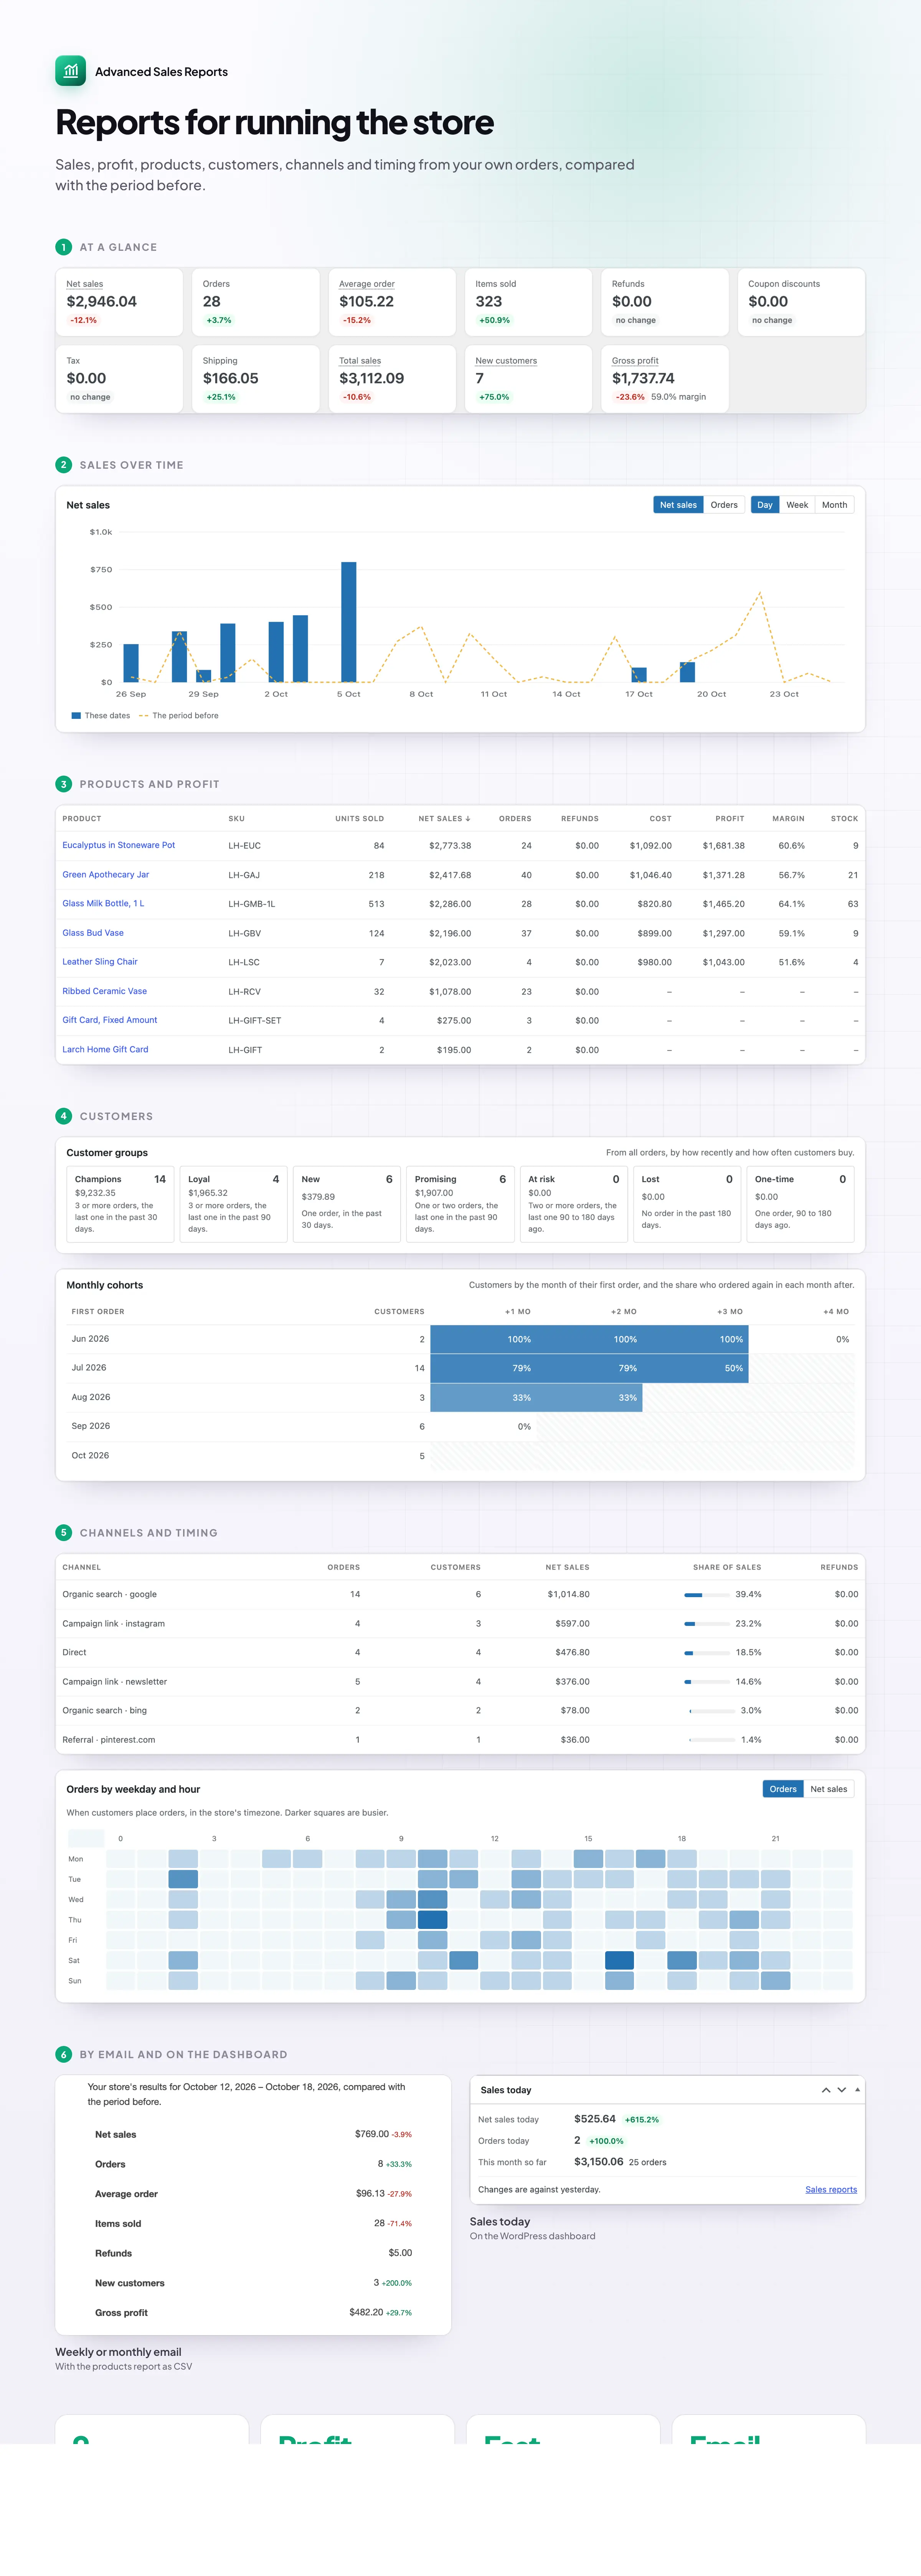
Advanced Sales Reports shows how your WooCommerce store is doing against last month or last year, what each product earns after its cost, and who your best customers are. It keeps its own copy of your order figures, so reports open quickly on big stores too.
📈 Every figure against the period before or the same period last year.
🗓️ Sales by day, week or month, with the period before drawn over it.
💰 Profit and margin per product and variation, from your costs.
👥 Customer groups: your best customers and the ones slipping away.
🔁 Cohorts that show who came back, month by month.
📣 Sales by channel, with each row’s share of sales.
⏰ Busiest days and hours in your store’s timezone.
📦 Days of stock left, worked out from recent sales.
Overview
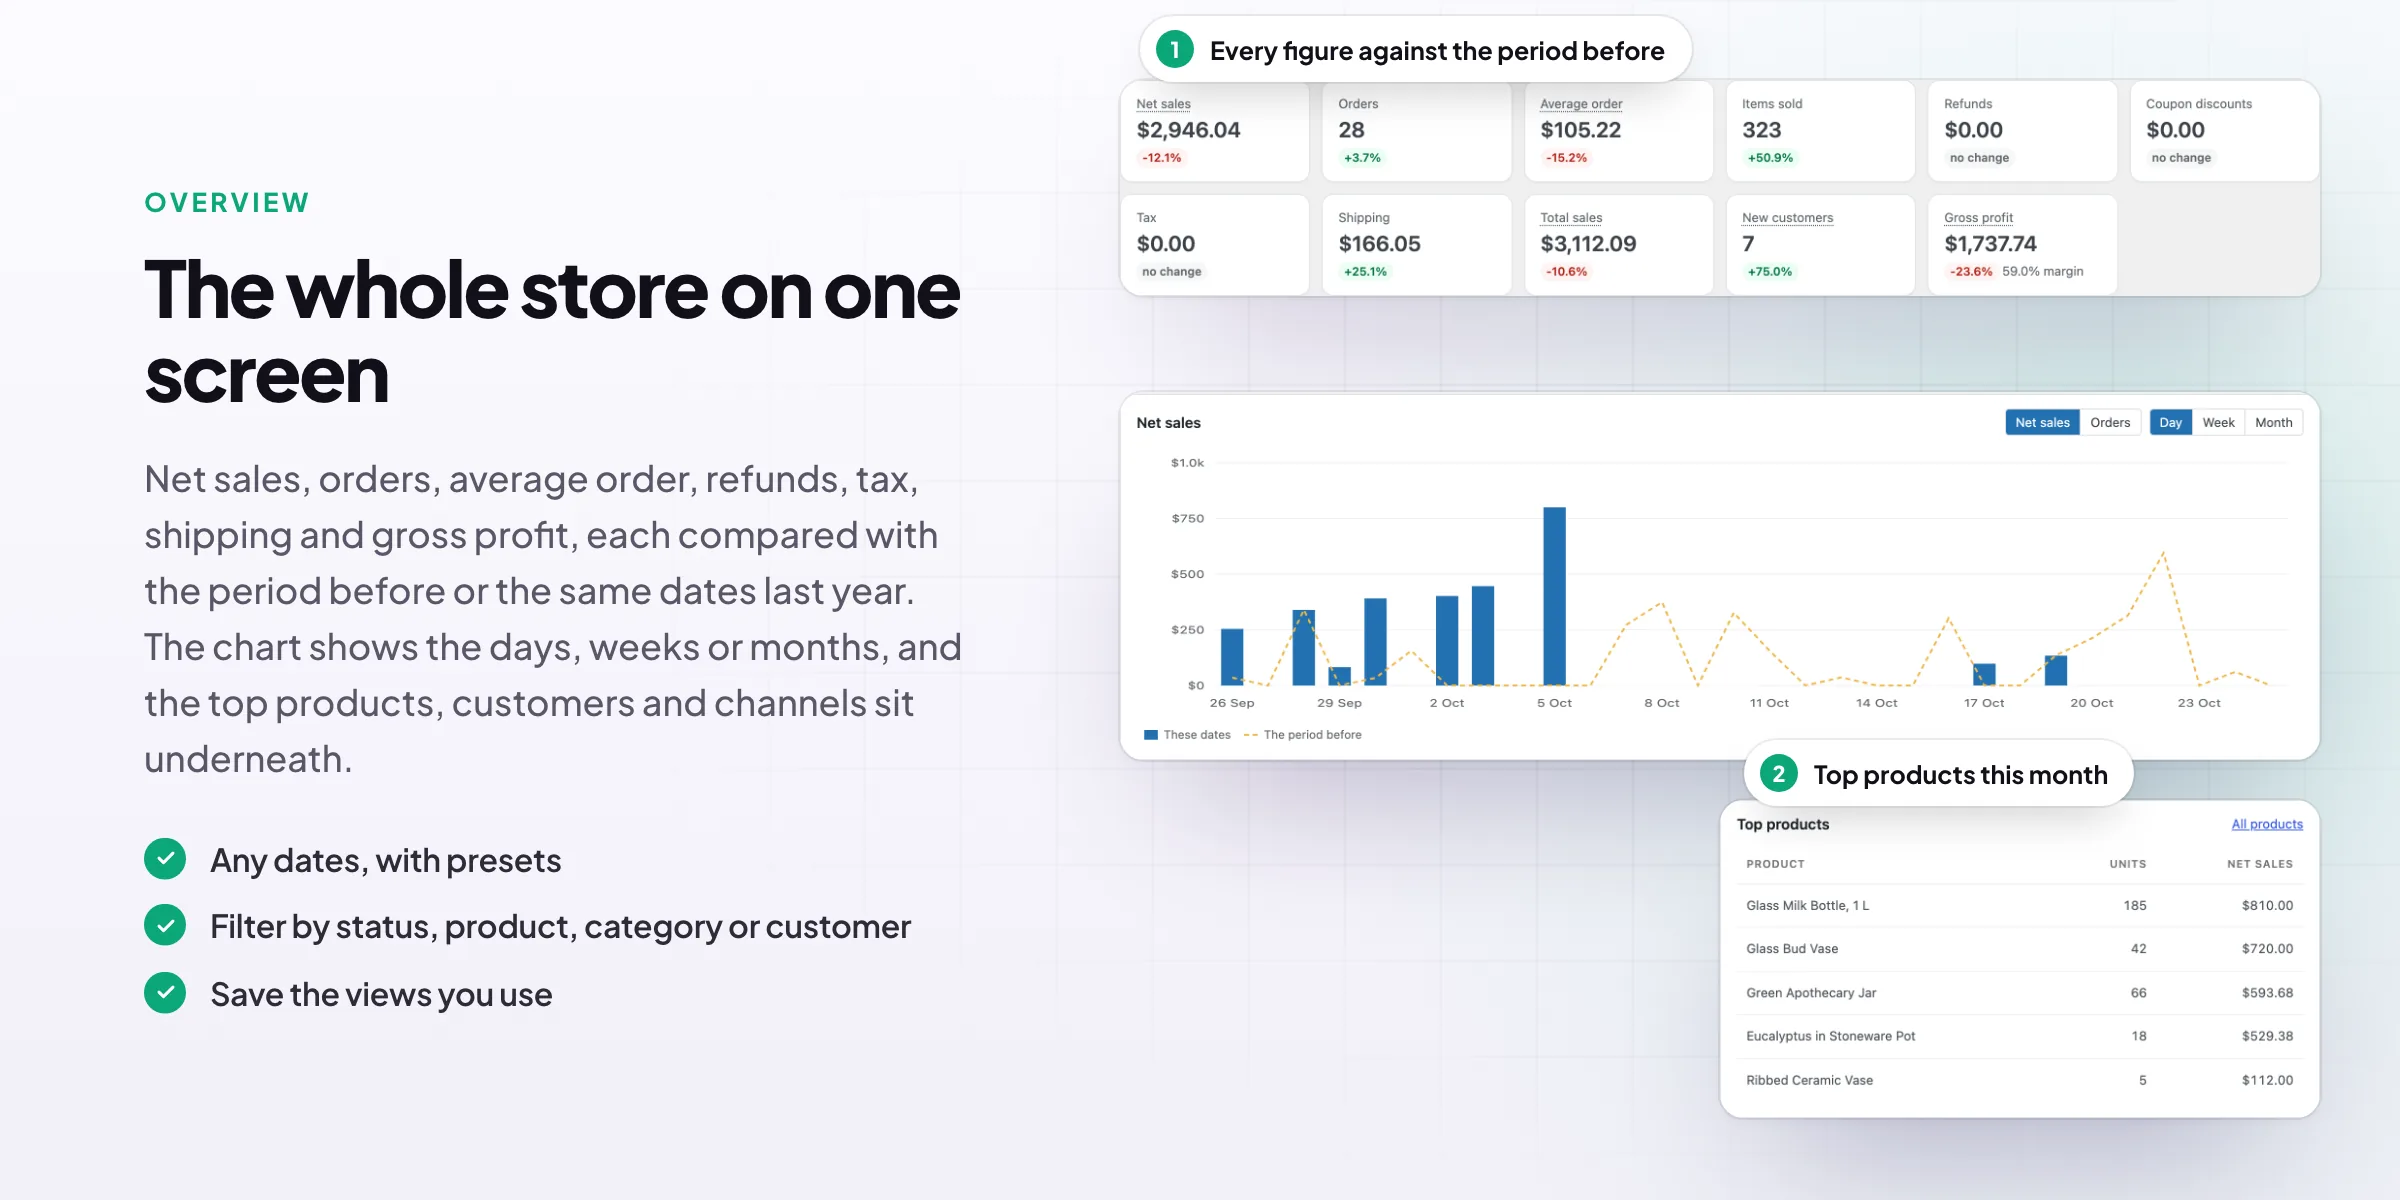
Every figure against the period before
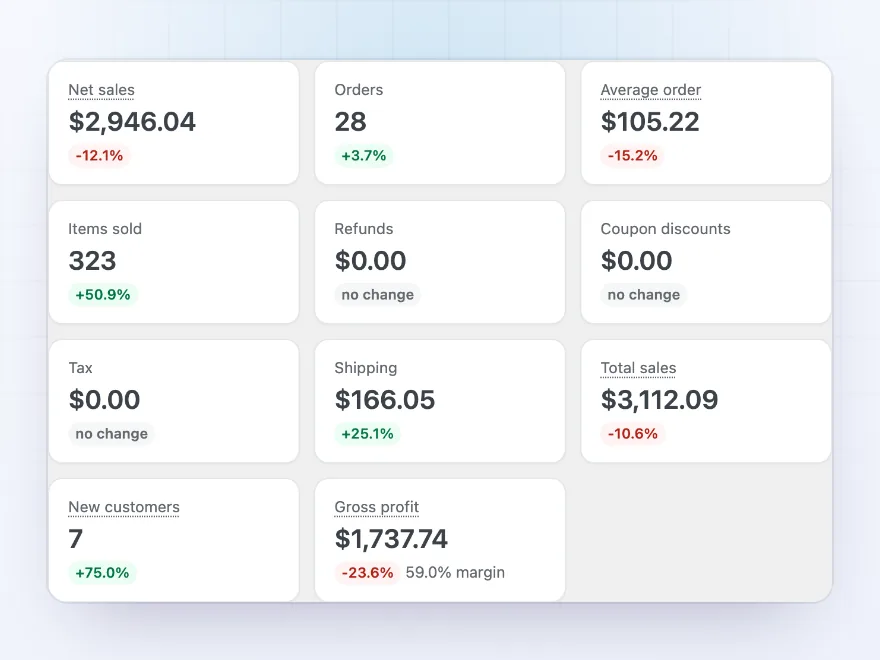
Net sales, orders, average order, items sold, refunds, coupon discounts, tax, shipping, total sales, new customers and gross profit, each with its change from the period before or the same dates last year. Pick today, the last 30 days, a quarter, a year or any dates.
- Presets or any dates
- Against the period before or last year
- Saved views for the reports you use
Sales over time
Sales or orders by day, week or month
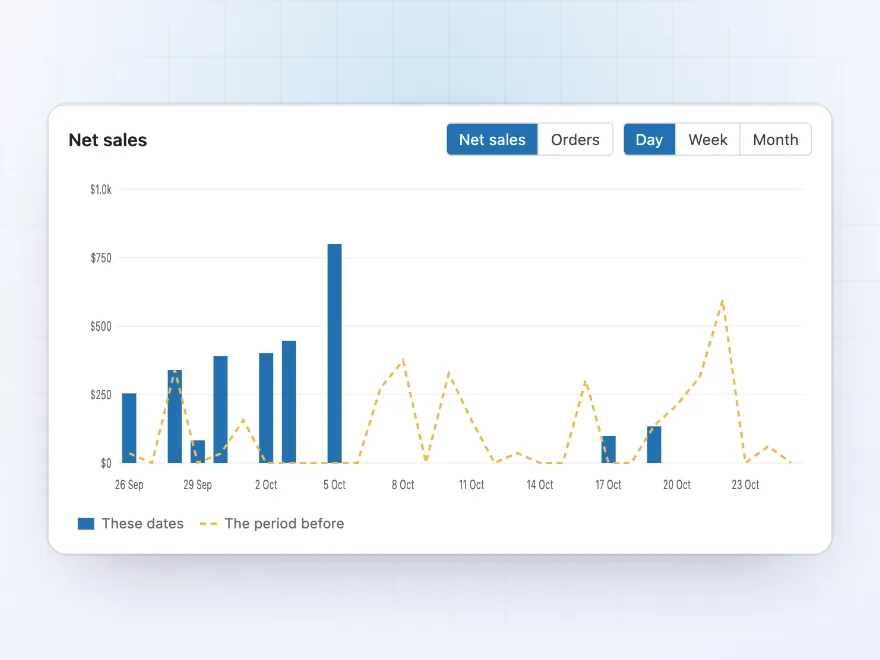
The chart shows net sales or orders by day, week or month, with the period before drawn over it as a line, so a good or slow week stands out. Filters for order status, product, category and customer change the chart and every figure on the page.
- Day, week or month
- The period before drawn over it
- Filters for status, product, category, customer
Profit
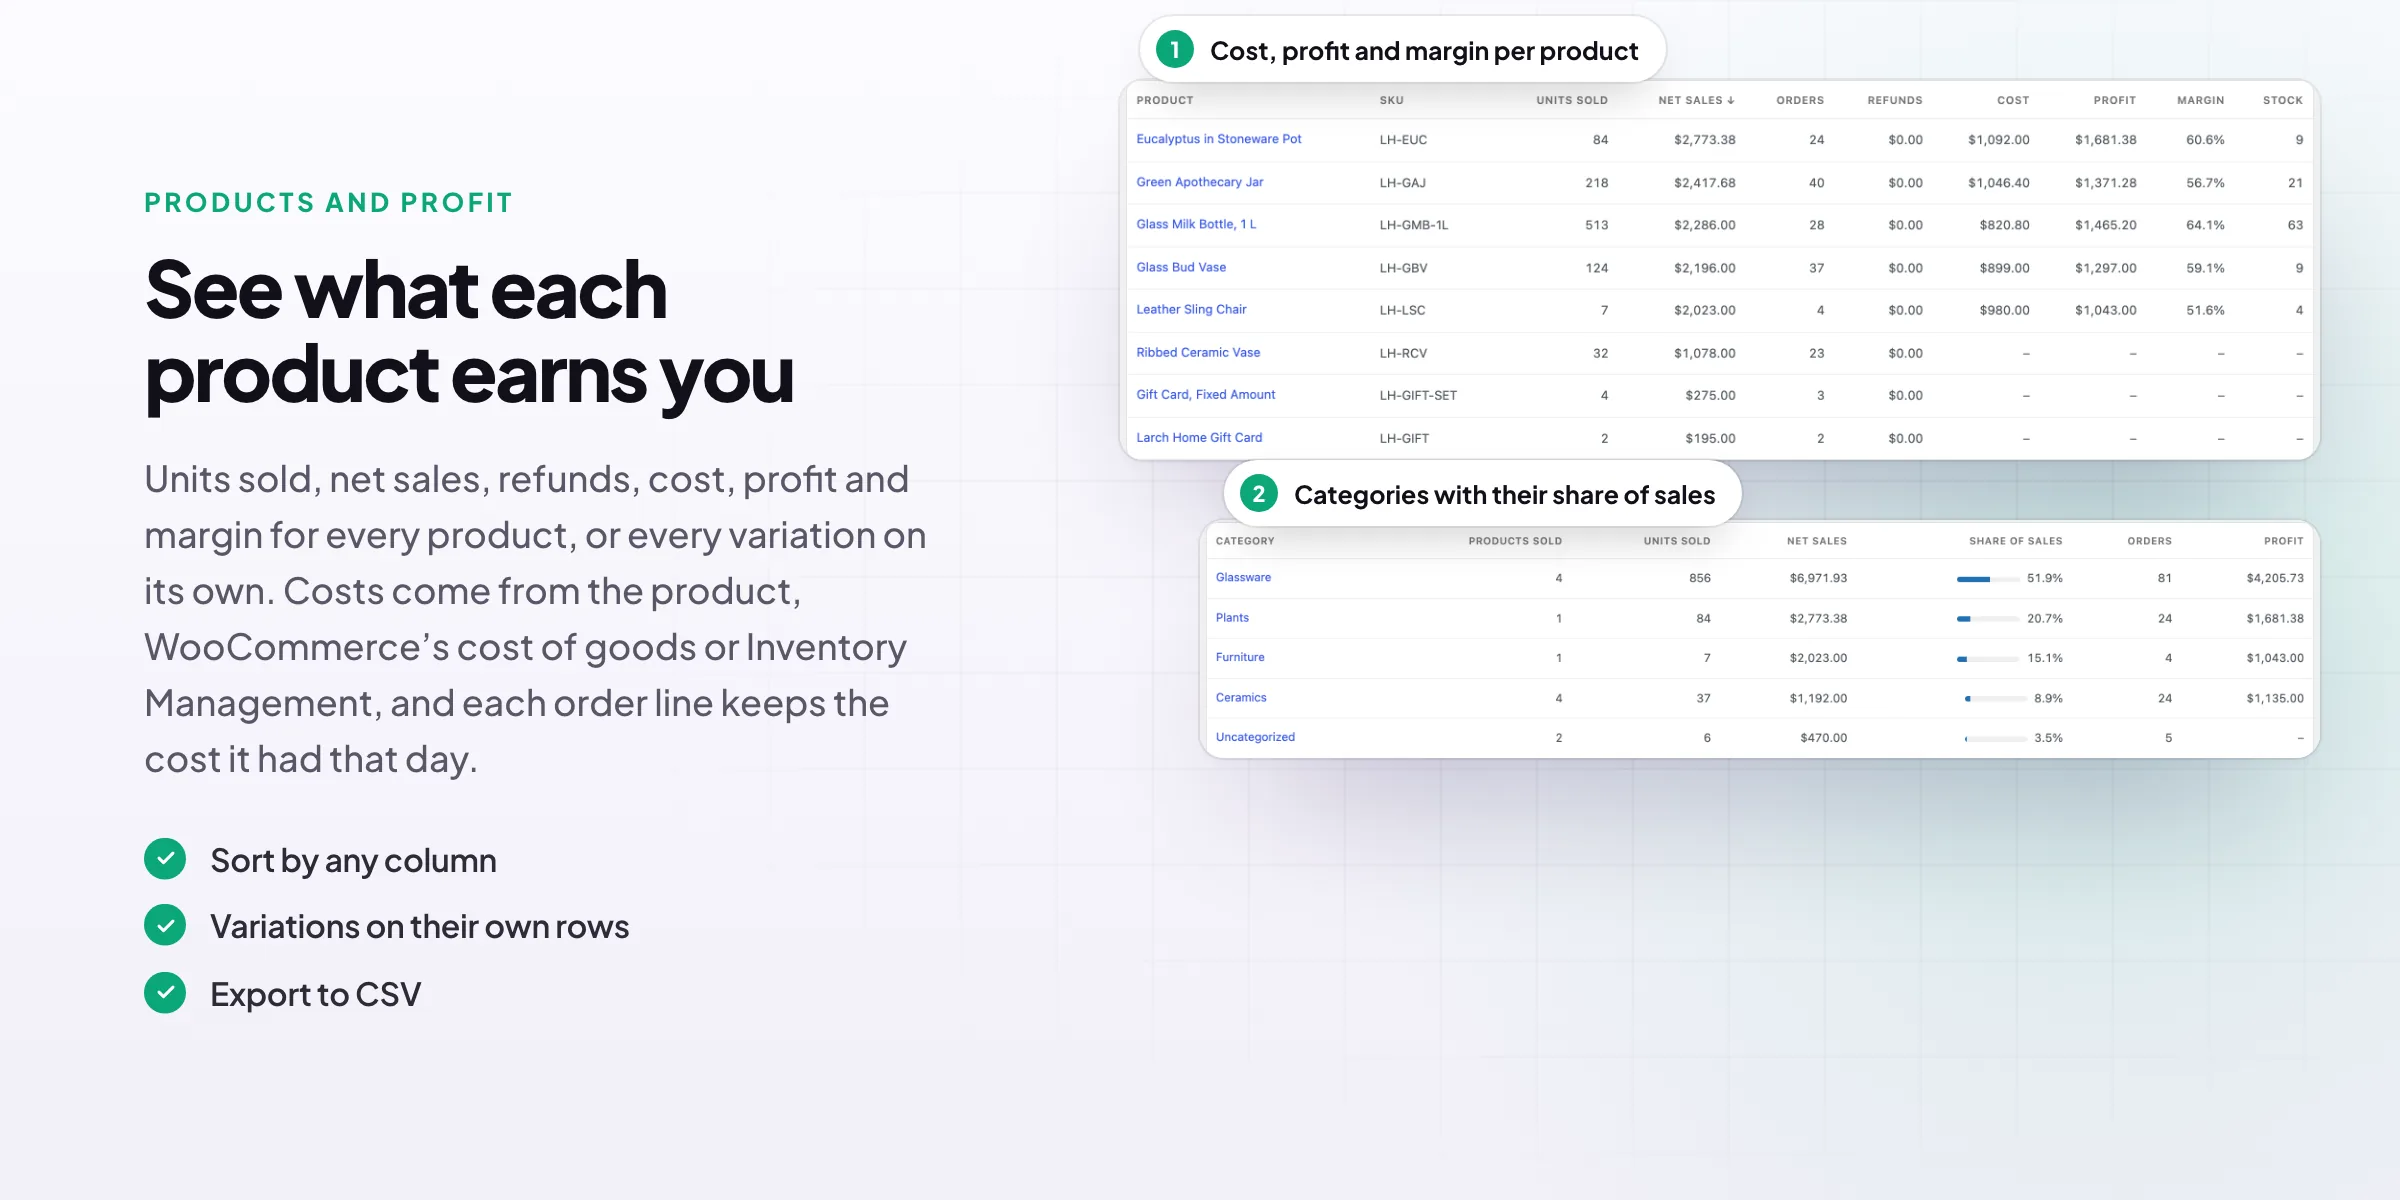
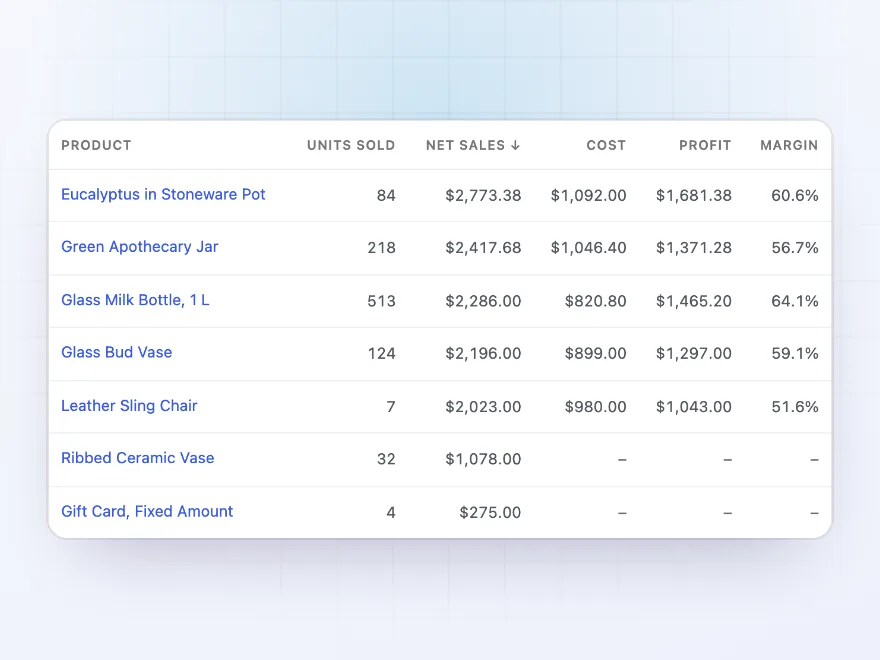
What each product earns you
The Products report shows units sold, net sales, cost, profit and margin for every product, or every variation on its own. Costs come from WooCommerce’s cost of goods, Inventory Management or a Cost field the plugin adds, and each order line keeps the cost it had that day.
- Cost, profit and margin per product
- Variations on their own rows
- Export to CSV
Customer groups
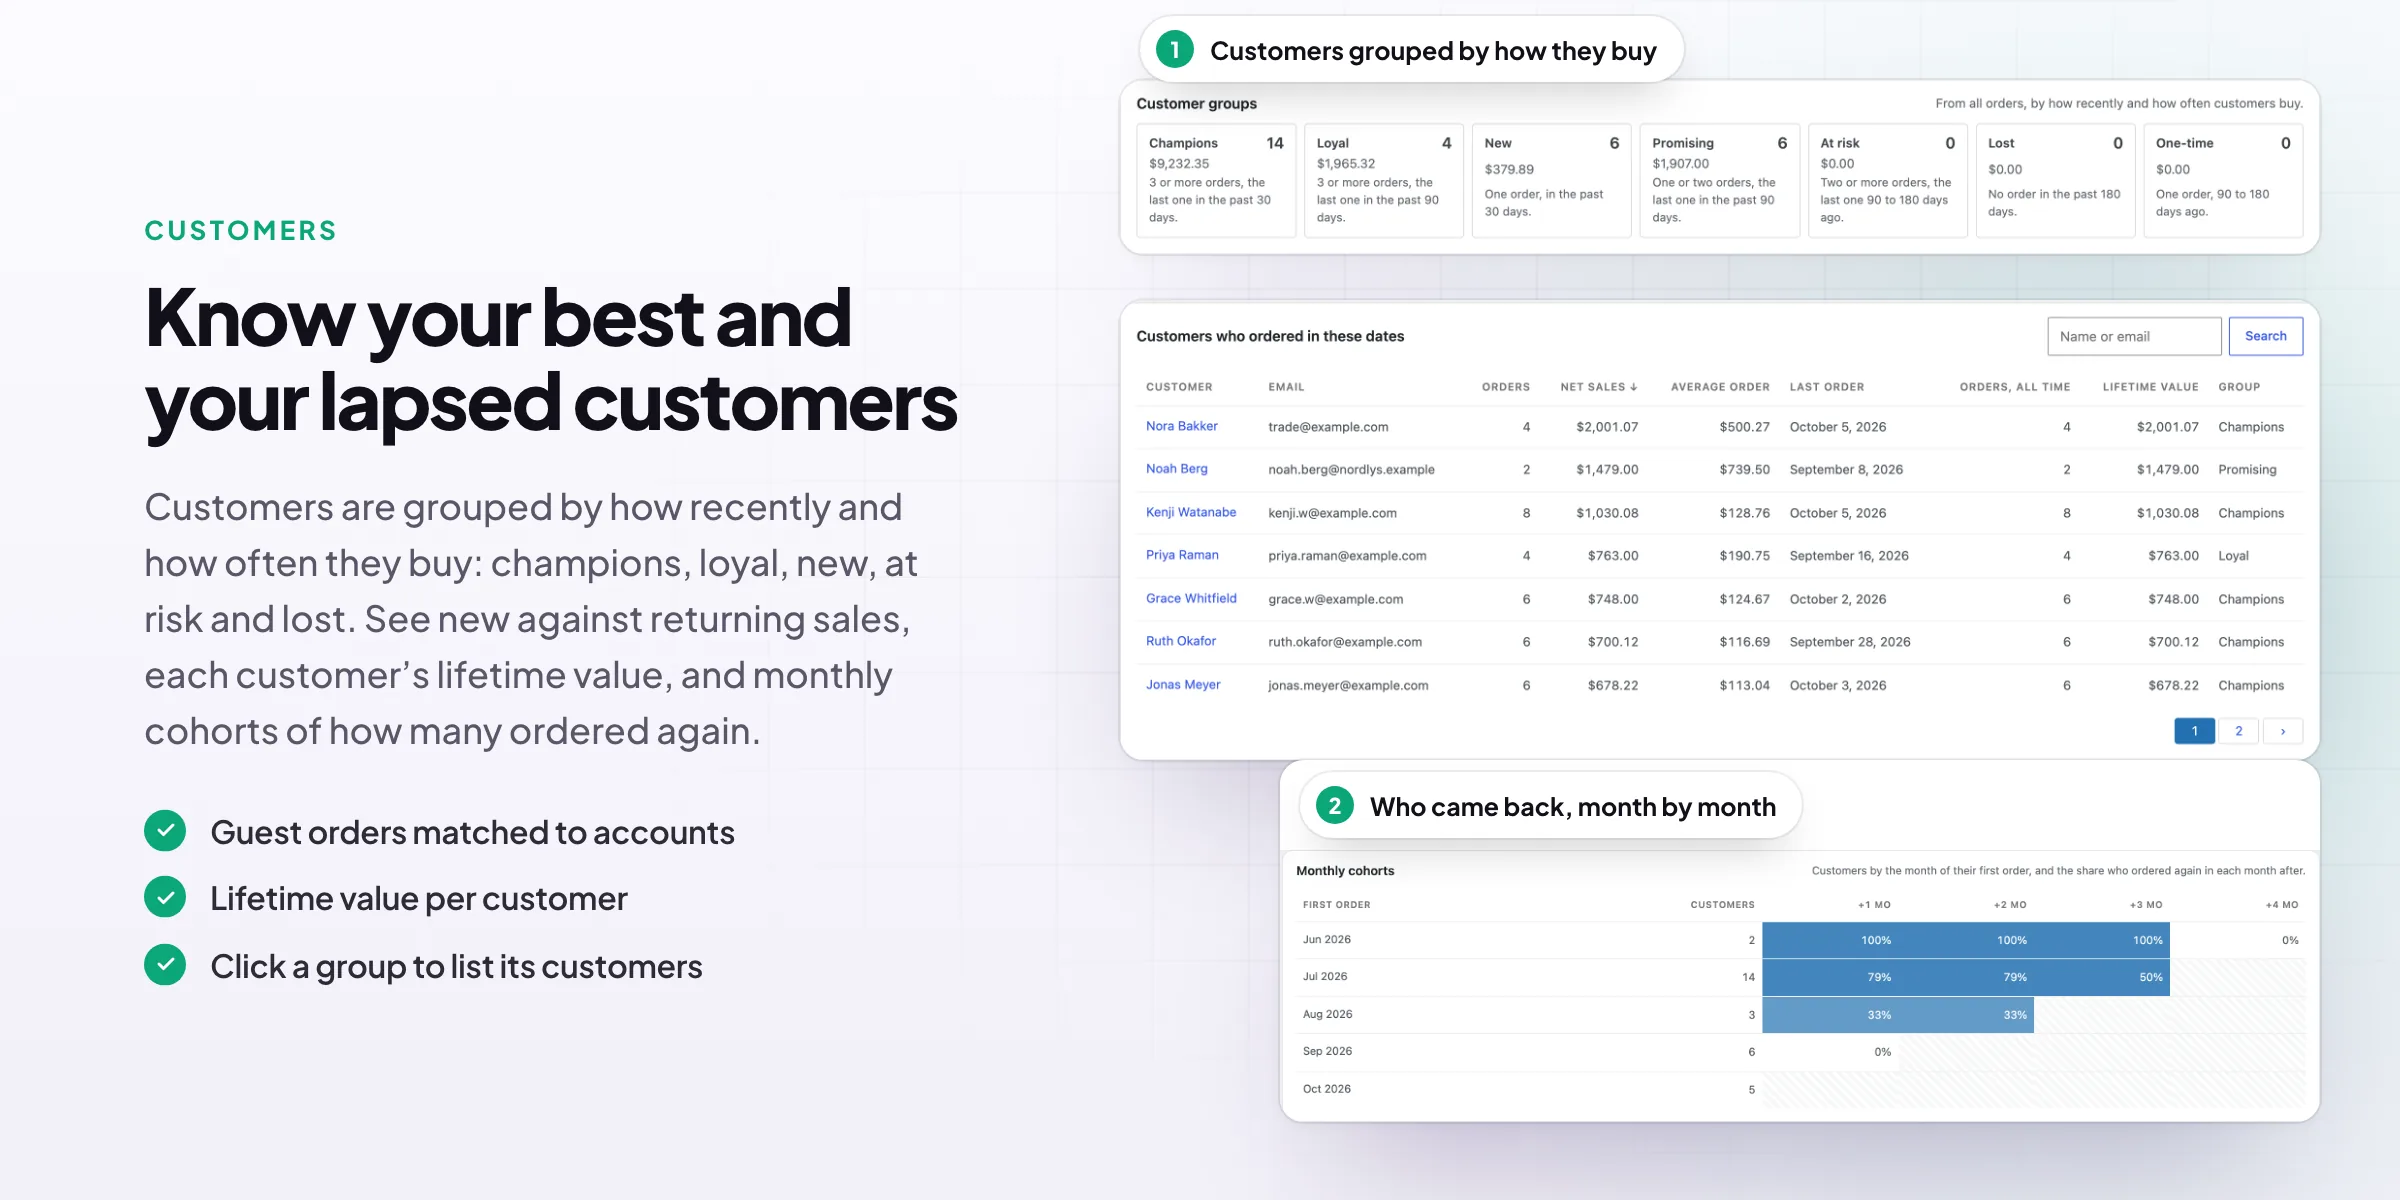
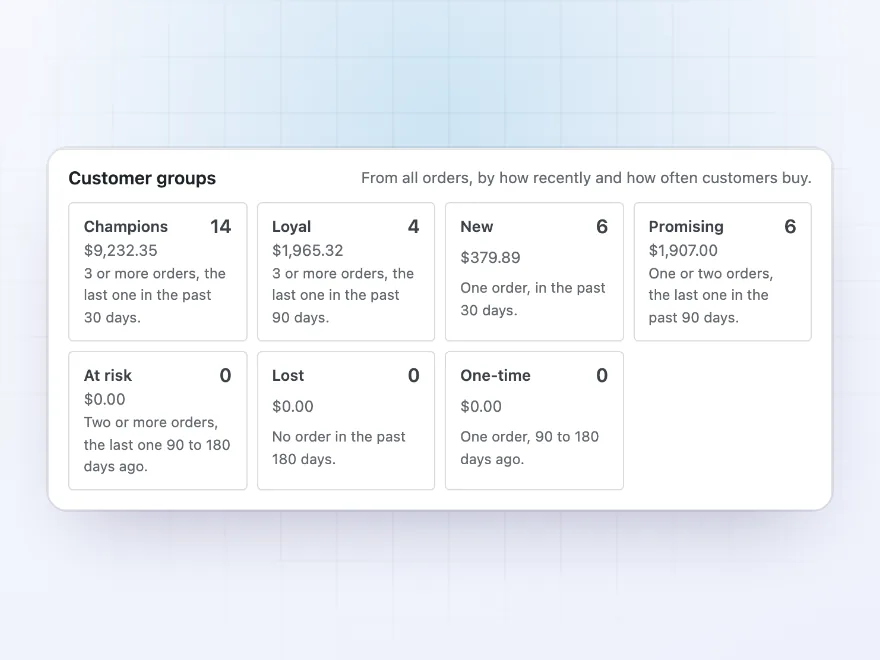
Your best customers, and the ones slipping away
Customers are grouped by how recently and how often they buy: champions, loyal, new, promising, at risk, lost and one-time. Each group shows how many customers it has and what they spent, and a click lists them, with their orders and lifetime value.
- Seven groups
- Spend and count per group
- Guest orders matched to accounts
Cohorts
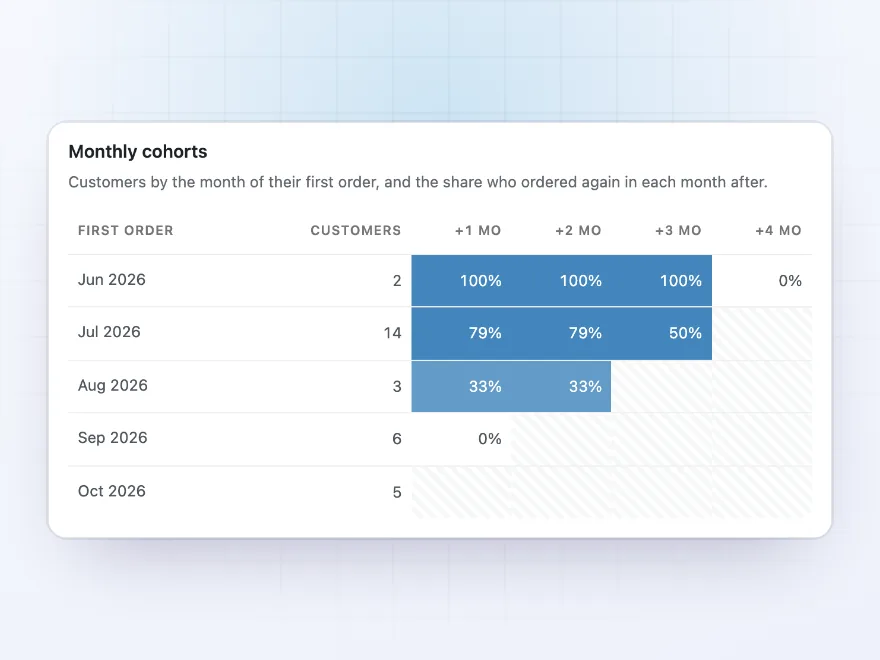
Who came back, month by month
Monthly cohorts show, for the customers who first ordered in each month, how many ordered again one, two or three months later. It tells you whether new customers stay, and whether that is getting better.
- By month of first order
- Share who ordered again
- Darker cells for more repeat orders
Channels
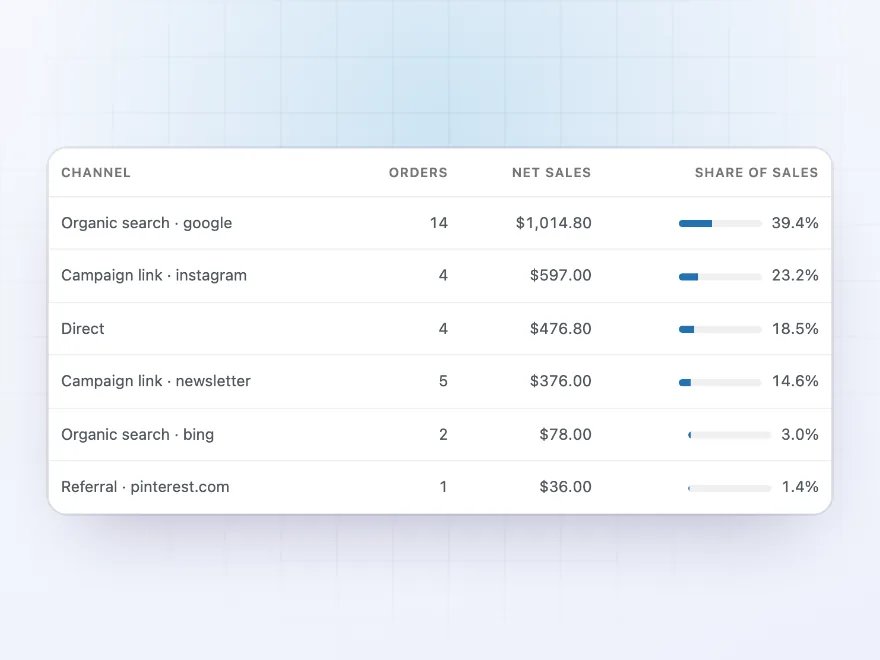
Where your sales come from
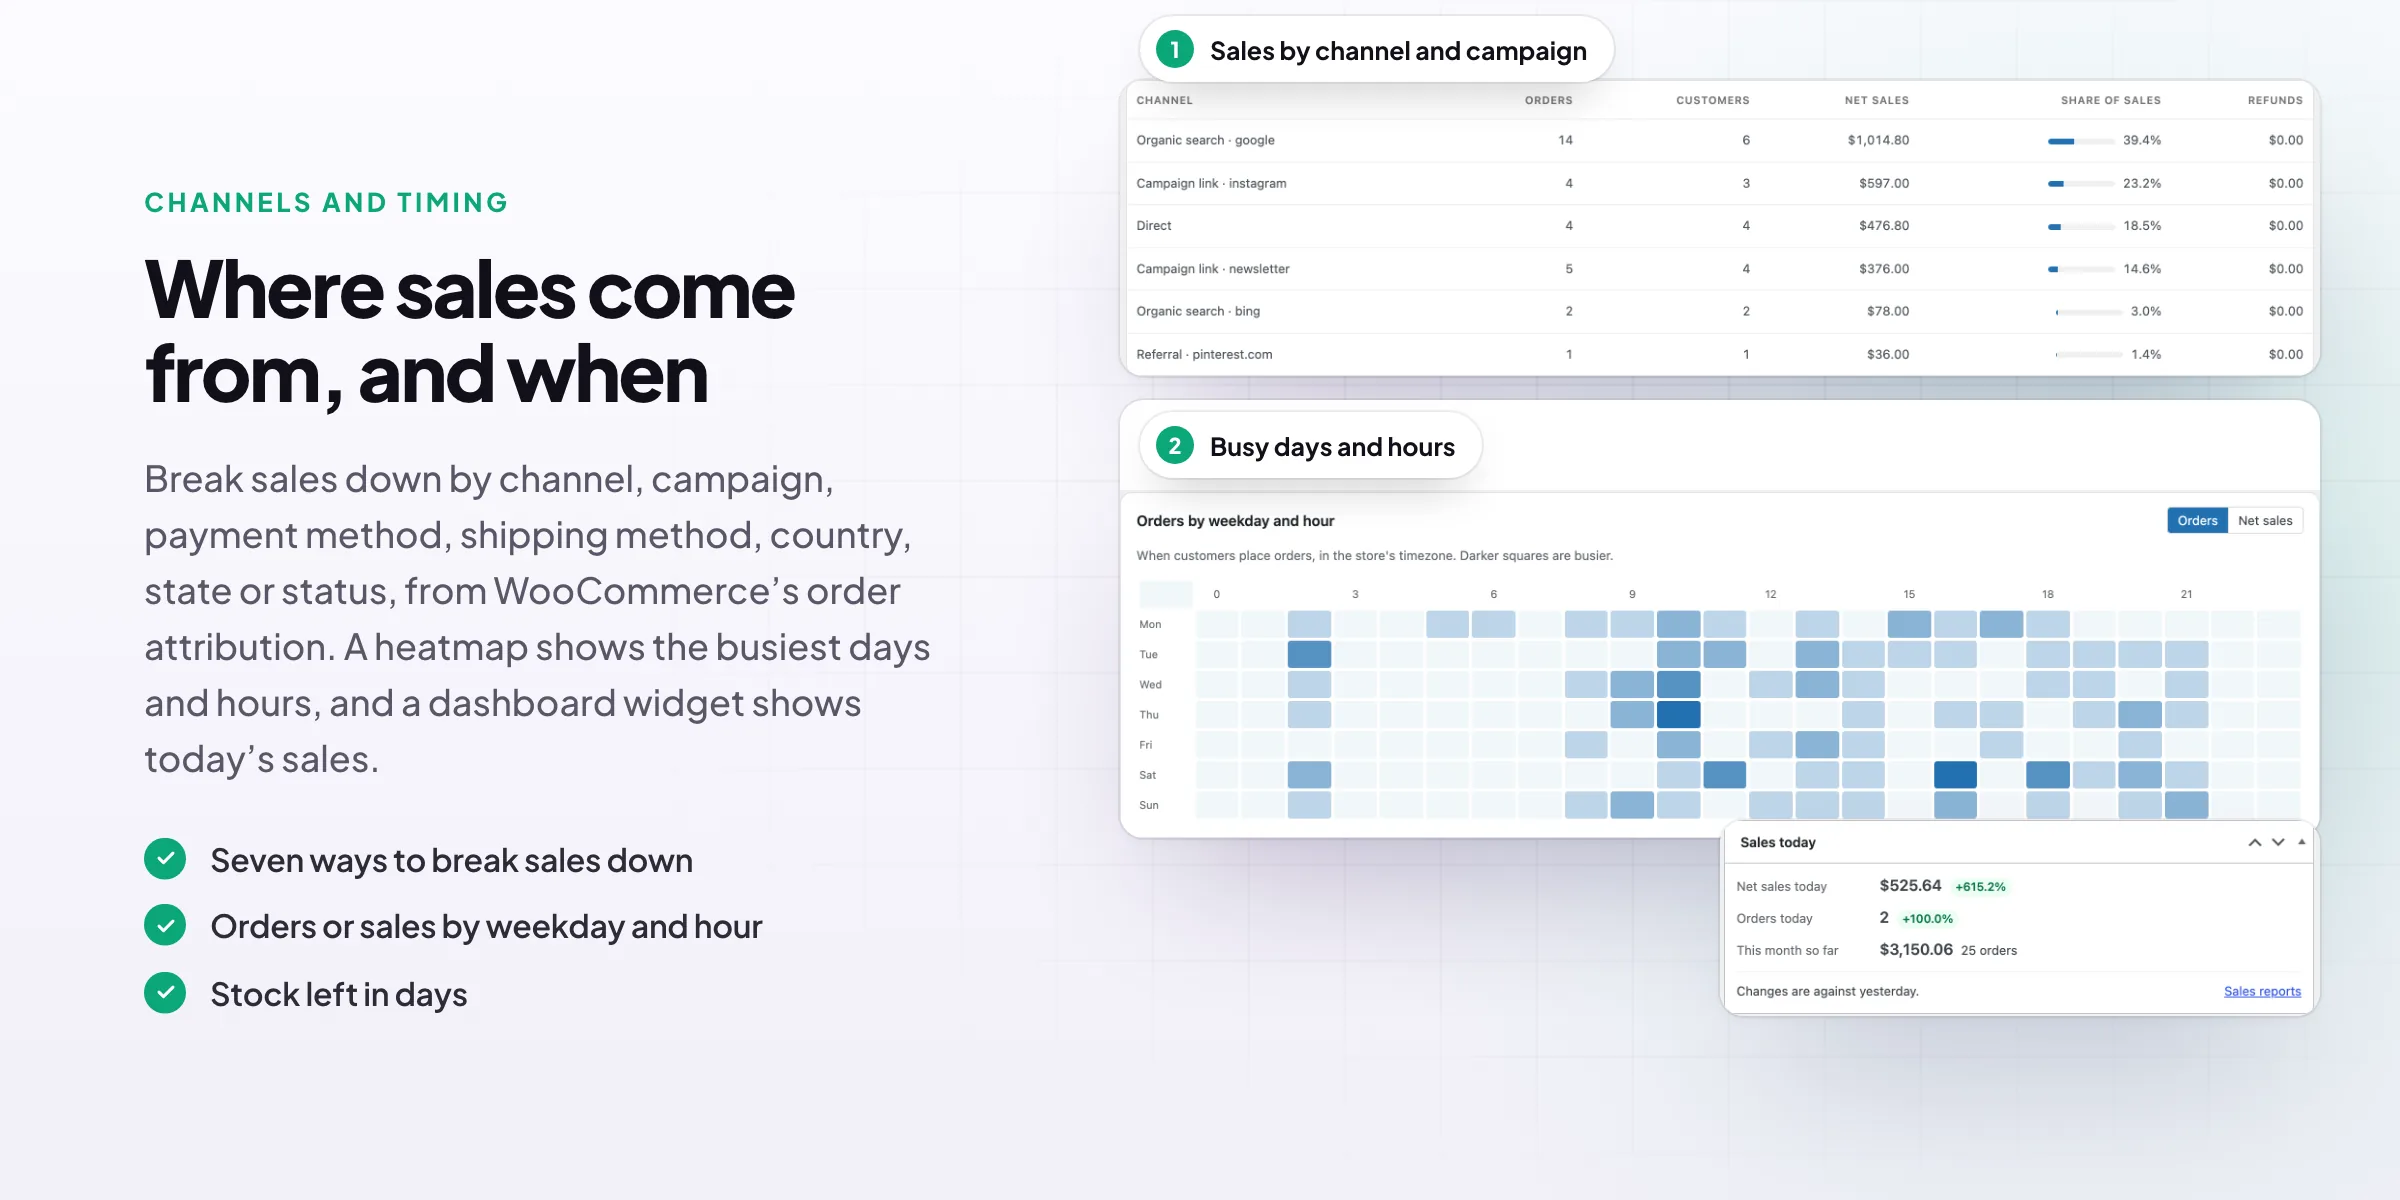
Break sales down by channel and campaign from WooCommerce’s order attribution, such as search, Instagram or a newsletter, or by payment method, shipping method, country, state and order status. Each row shows orders, customers, net sales, its share and refunds.
- Seven ways to break sales down
- Share of sales per row
- Refunds on the day they’re made
Timing
The busiest days and hours
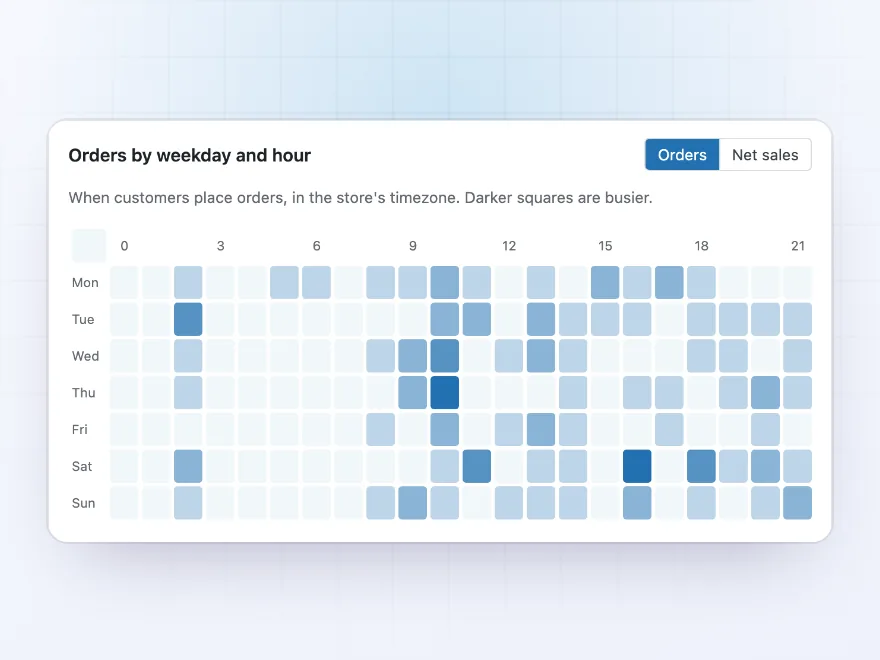
A heatmap shows when customers place orders, by weekday and hour in your store’s timezone, as orders or as sales. Use it to time emails and sales, plan staff, and pick a quiet hour for maintenance.
- Orders or net sales
- In your store’s timezone
- Any dates and filters
Stock
How many days your stock will last
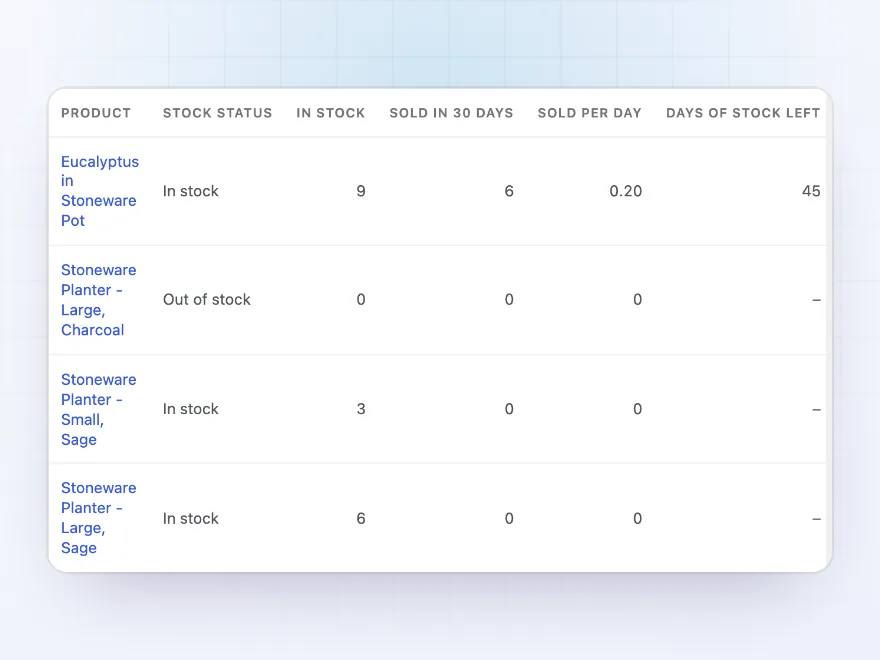
The Stock report lists products that are out of stock, on backorder or running low, with how many sold in the last 30 days, how many sell per day and how many days the stock left will last at that speed, so you know what to reorder first.
- Sold per day from recent sales
- Days of stock left
- Out of stock and backorders
Email report
The main figures in your inbox
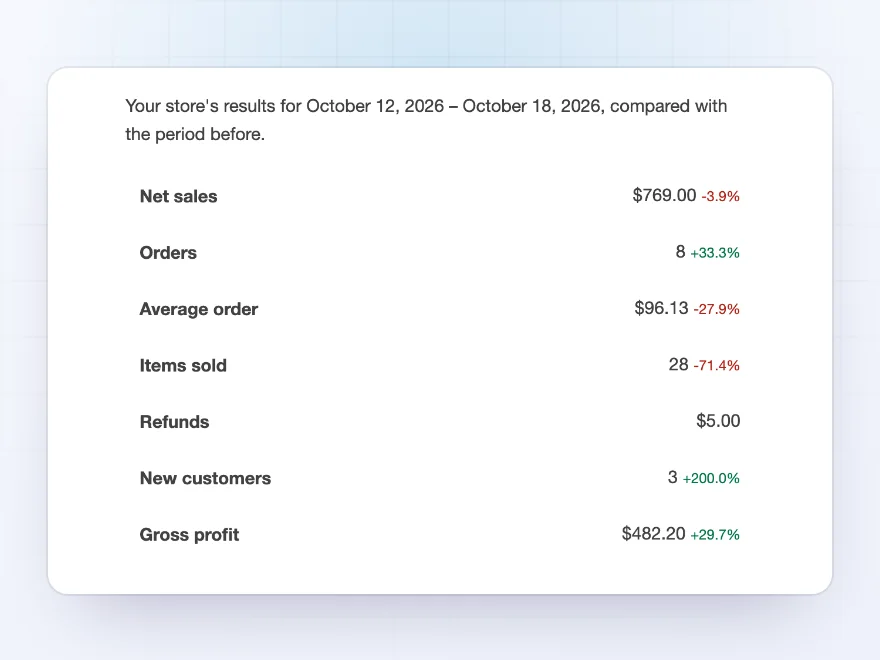
Get a weekly email every Monday for the week before, or a monthly one on the 1st, with net sales, orders, profit and the change from the period before, the top products and categories, new and returning customers and channels. The products report comes attached as a CSV file.
- Weekly or monthly
- To any addresses
- Products report as CSV
Premium quality & support
Support you can count on, year after year
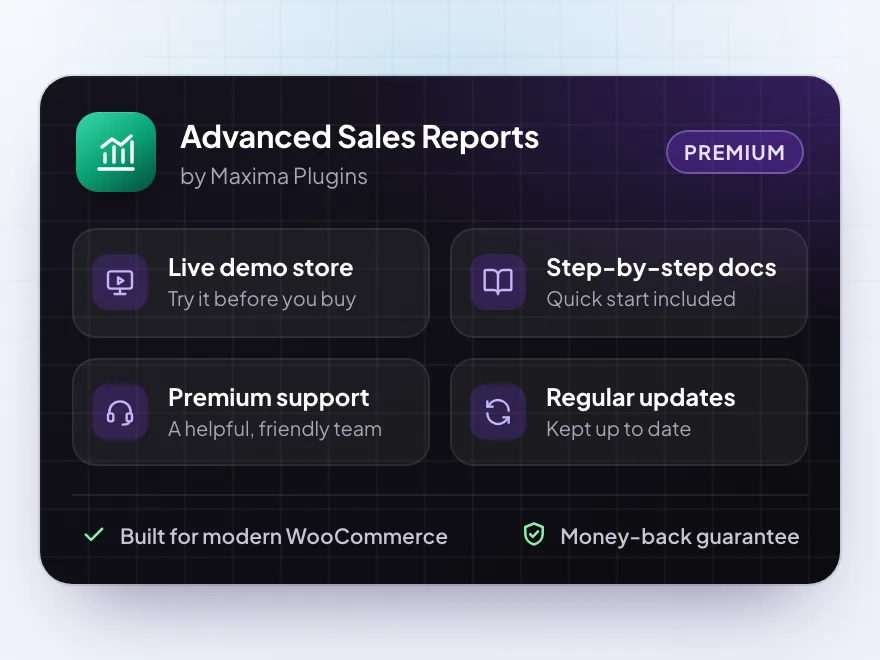
See Advanced Sales Reports working in a live demo store before you buy. If you need a hand, our friendly support team will help you get it set up, and regular updates keep it working with each new WooCommerce release.
- A live demo store to try it first
- Step-by-step docs with a quick start
- Premium support from a helpful team
- Regular updates included
WooCommerce analytics with profit, customers and channels
Advanced Sales Reports is a WooCommerce reports plugin for store owners who want answers, not just totals. It shows net sales, orders and profit against the period before or the same dates last year, which products and categories earn the most after their cost, and which customers buy again.
It adds what WooCommerce analytics leaves out: profit and margin from your product costs, customer groups and monthly cohorts, sales by channel and campaign, the busiest days and hours, and how many days your stock will last. A Sales today widget sits on your WooCommerce dashboard, and a weekly or monthly email brings the main figures to your inbox with the products report attached.
Common setups
Questions before you buy
How is it different from WooCommerce Analytics?
It adds profit and margin, customer groups and cohorts, lifetime value, sales by channel and campaign, the weekday and hour view, stock days left, saved views and an email report. It keeps its own tables, so it doesn’t depend on Analytics’ import.
Which orders are counted?
Orders in the statuses you choose in the settings: processing, completed and on hold by default. The filter bar can change this for one report.
What do net sales include?
What customers paid for products and fees after coupons and refunds, without tax and shipping. Total sales include tax and shipping.
Where do product costs come from?
From WooCommerce’s cost of goods sold when it’s on, from Inventory Management when it’s active, or from a Cost field the plugin adds to products and variations. Each order line keeps the cost from when it was ordered.
Where do channels come from?
From WooCommerce’s order attribution, which records whether a customer came directly, from search, from another site or from a campaign link. Orders placed before it was on show as Unknown.
How long does reading my orders take?
About a minute per few thousand orders, in the background. New and changed orders are added within moments.
Can I export the reports?
Yes. Every report table exports to a CSV file that opens in Excel, and any report can be printed or saved as a PDF from the print window.
Requirements
- WordPress
- 6.8 or newer
- WooCommerce
- 10.0 or newer
- PHP
- 7.4 or newer
Works with
- Classic themes
- Block themes
- Cart and Checkout blocks
- High-Performance Order Storage
- Orders stored as posts
Channels need WooCommerce’s order attribution.

Dries –
Reports are good but take a while to load with a large catalogue. Four stars.
Vera –
works well. the export to CSV is handy for our accountant
Tim –
Useful comparison
Comparing this month with last year showed me two products I should drop.
mariekev –
the weekly report lands in my inbox on Monday. James helped me add shipping costs
Koen –
Profit per product in one screen is exactly what I wanted. The cost field is easy to fill in.
Tomas L. –
The weekly email report is handy. took me a while to add our costs
Celine R. –
Profit per product
Finally profit per product in one place. The comparison with last year is useful. James helped me add our costs.